Using the dashboard
By default, the Dashboard page is the first page that you see after you register and log in. It displays the Default dashboard. The default dashboards are preconfigured.
You can change the default home page and default dashboard by using the Application customization option under User preferences. For more information, see Customizing the EDX application.
The dashboard shows some widgets by default. Widgets are clickable and show additional details when you click them.
You can use the Browse dashboards option to view the other dashboards.
- Your dashboards, which are listed under My
dashboards.
- Default dashboard: It includes a set of standard widgets. The
default widgets include:
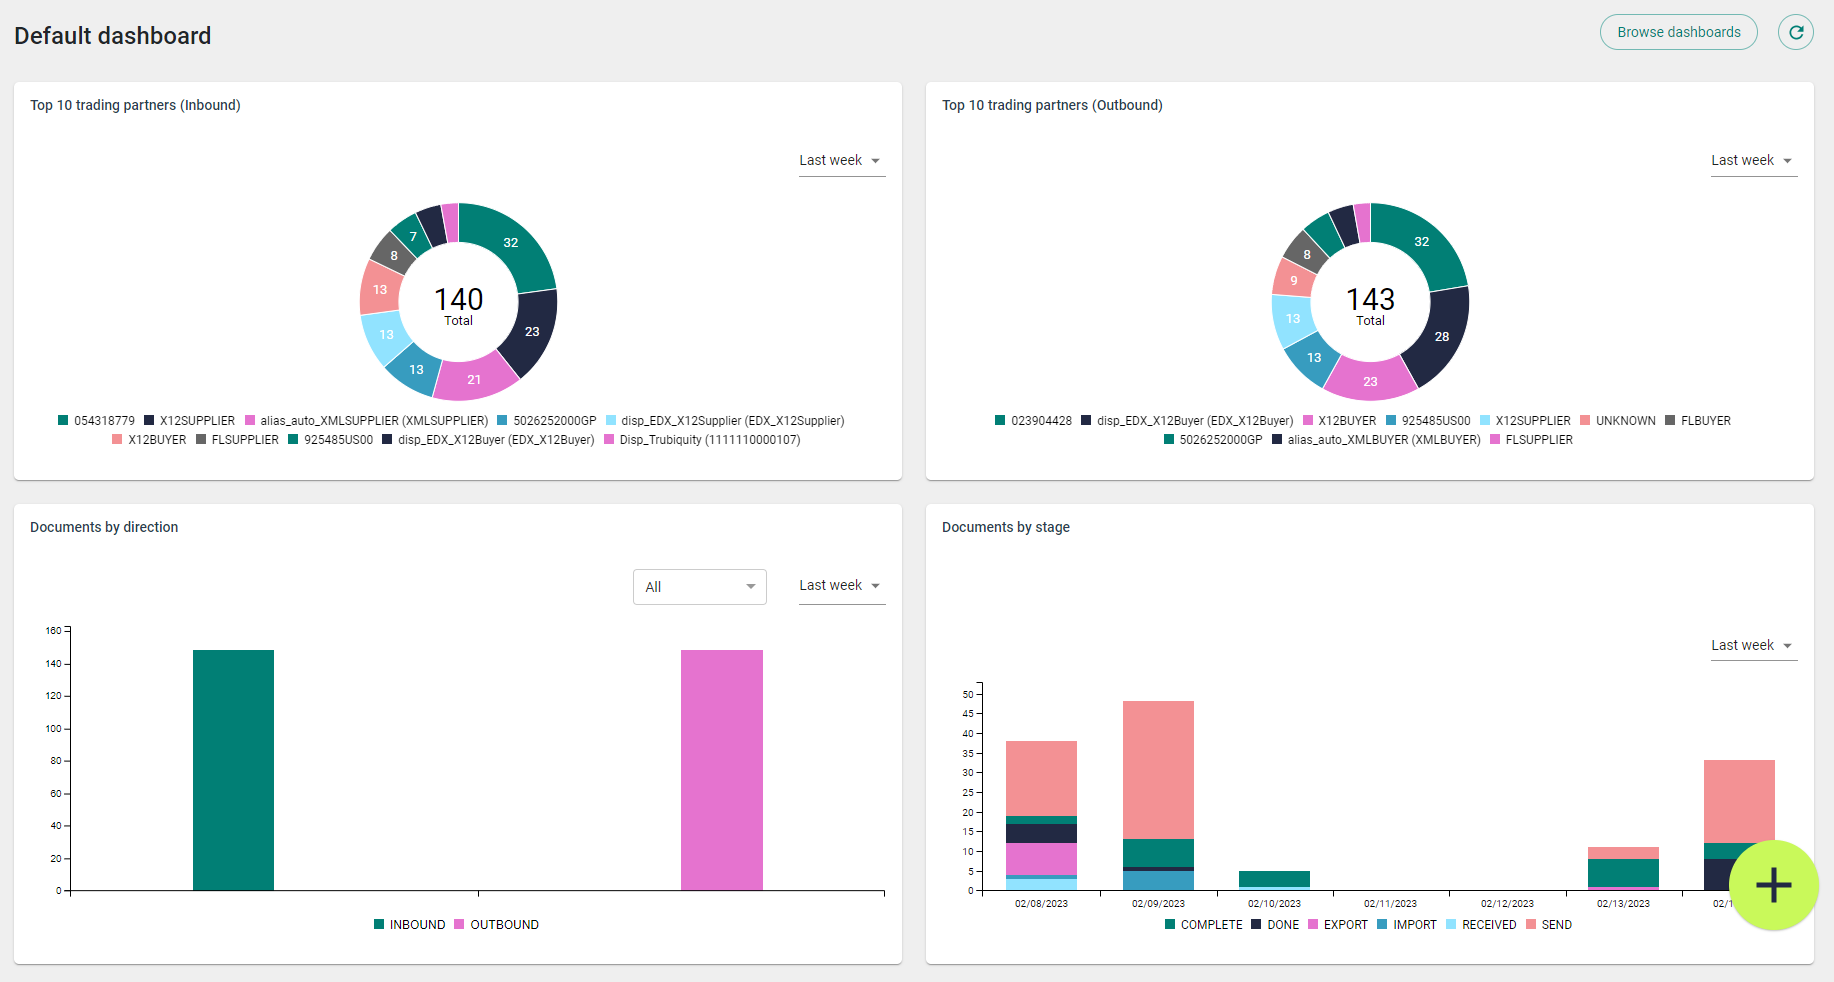
- Top 10 trading partners
(Inbound): This widget displays a pie chart
showing the top 10 trading partners based on the volume of
incoming messages (number of messages) sent by the
respective trading partners for time ranges such as day
(current day), week, month, year, or custom date
range.
You can view the partner name by hovering the cursor over the partner legend. You can also see legends in different colors with basic details of the partners and document counts.
- Top 10 trading partners
(Outbound): This widget displays a pie chart
showing the top 10 trading partners based on the volume of
outgoing messages (number of messages) received by the
respective trading partners for time ranges such as day
(current day), week, month, year, or custom date
range.
You can view the partner name by hovering the cursor over the partner legend. You can also see legends in different colors with basic details of the partners and document counts.
- Documents by direction: This widget displays a bar chart showing the counts of incoming and outgoing EDI documents for different trading partners.
- Documents by stage: This widget
displays a bar chart showing the number of documents in
different stages of business processing, such as Sent,
Received, Imported, and so on, for the specified time
range.
This chart also has legends and color schemes representing the different stages, to enable you to take actions on documents that might need your attention.
Note: You cannot share the default dashboard because it is already shared. - Top 10 trading partners
(Inbound): This widget displays a pie chart
showing the top 10 trading partners based on the volume of
incoming messages (number of messages) sent by the
respective trading partners for time ranges such as day
(current day), week, month, year, or custom date
range.
- Any other dashboards that you created. See Creating dashboards. You can also customize your dashboards by adding your own widgets, as described in Creating customized dashboard widgets.
- Default dashboard: It includes a set of standard widgets. The
default widgets include:
- Shared dashboards, which are dashboards that other users shared with you in view-only mode.
Use the Dashboard page to perform the following tasks:
- Monitor statistics for the current day, last week, last month, or last year.
- Monitor statistics according to the set of filters.
To update the dashboard widgets and display the latest data, click
Refresh
![]() . The Refresh button is available on the default
dashboard, and on all the custom dashboards you have created.
. The Refresh button is available on the default
dashboard, and on all the custom dashboards you have created.
To display a specific set of results, add filters. For more information about filters, see Creating filters.
For the illustration of the Dashboard page with charts and selected filters, see Figure 1.
You can quickly navigate to the Documents page by clicking on the widget or any specified value in the chart. If you click the widget, you open the Documents table, which shows the business documents with filters that are predefined for this widget.
If you click a colored part of some charts, you open the Documents table, which shows the business documents with Date/Time and other filters that are set for the corresponding stage, date, and time.